Browsing the Ontology
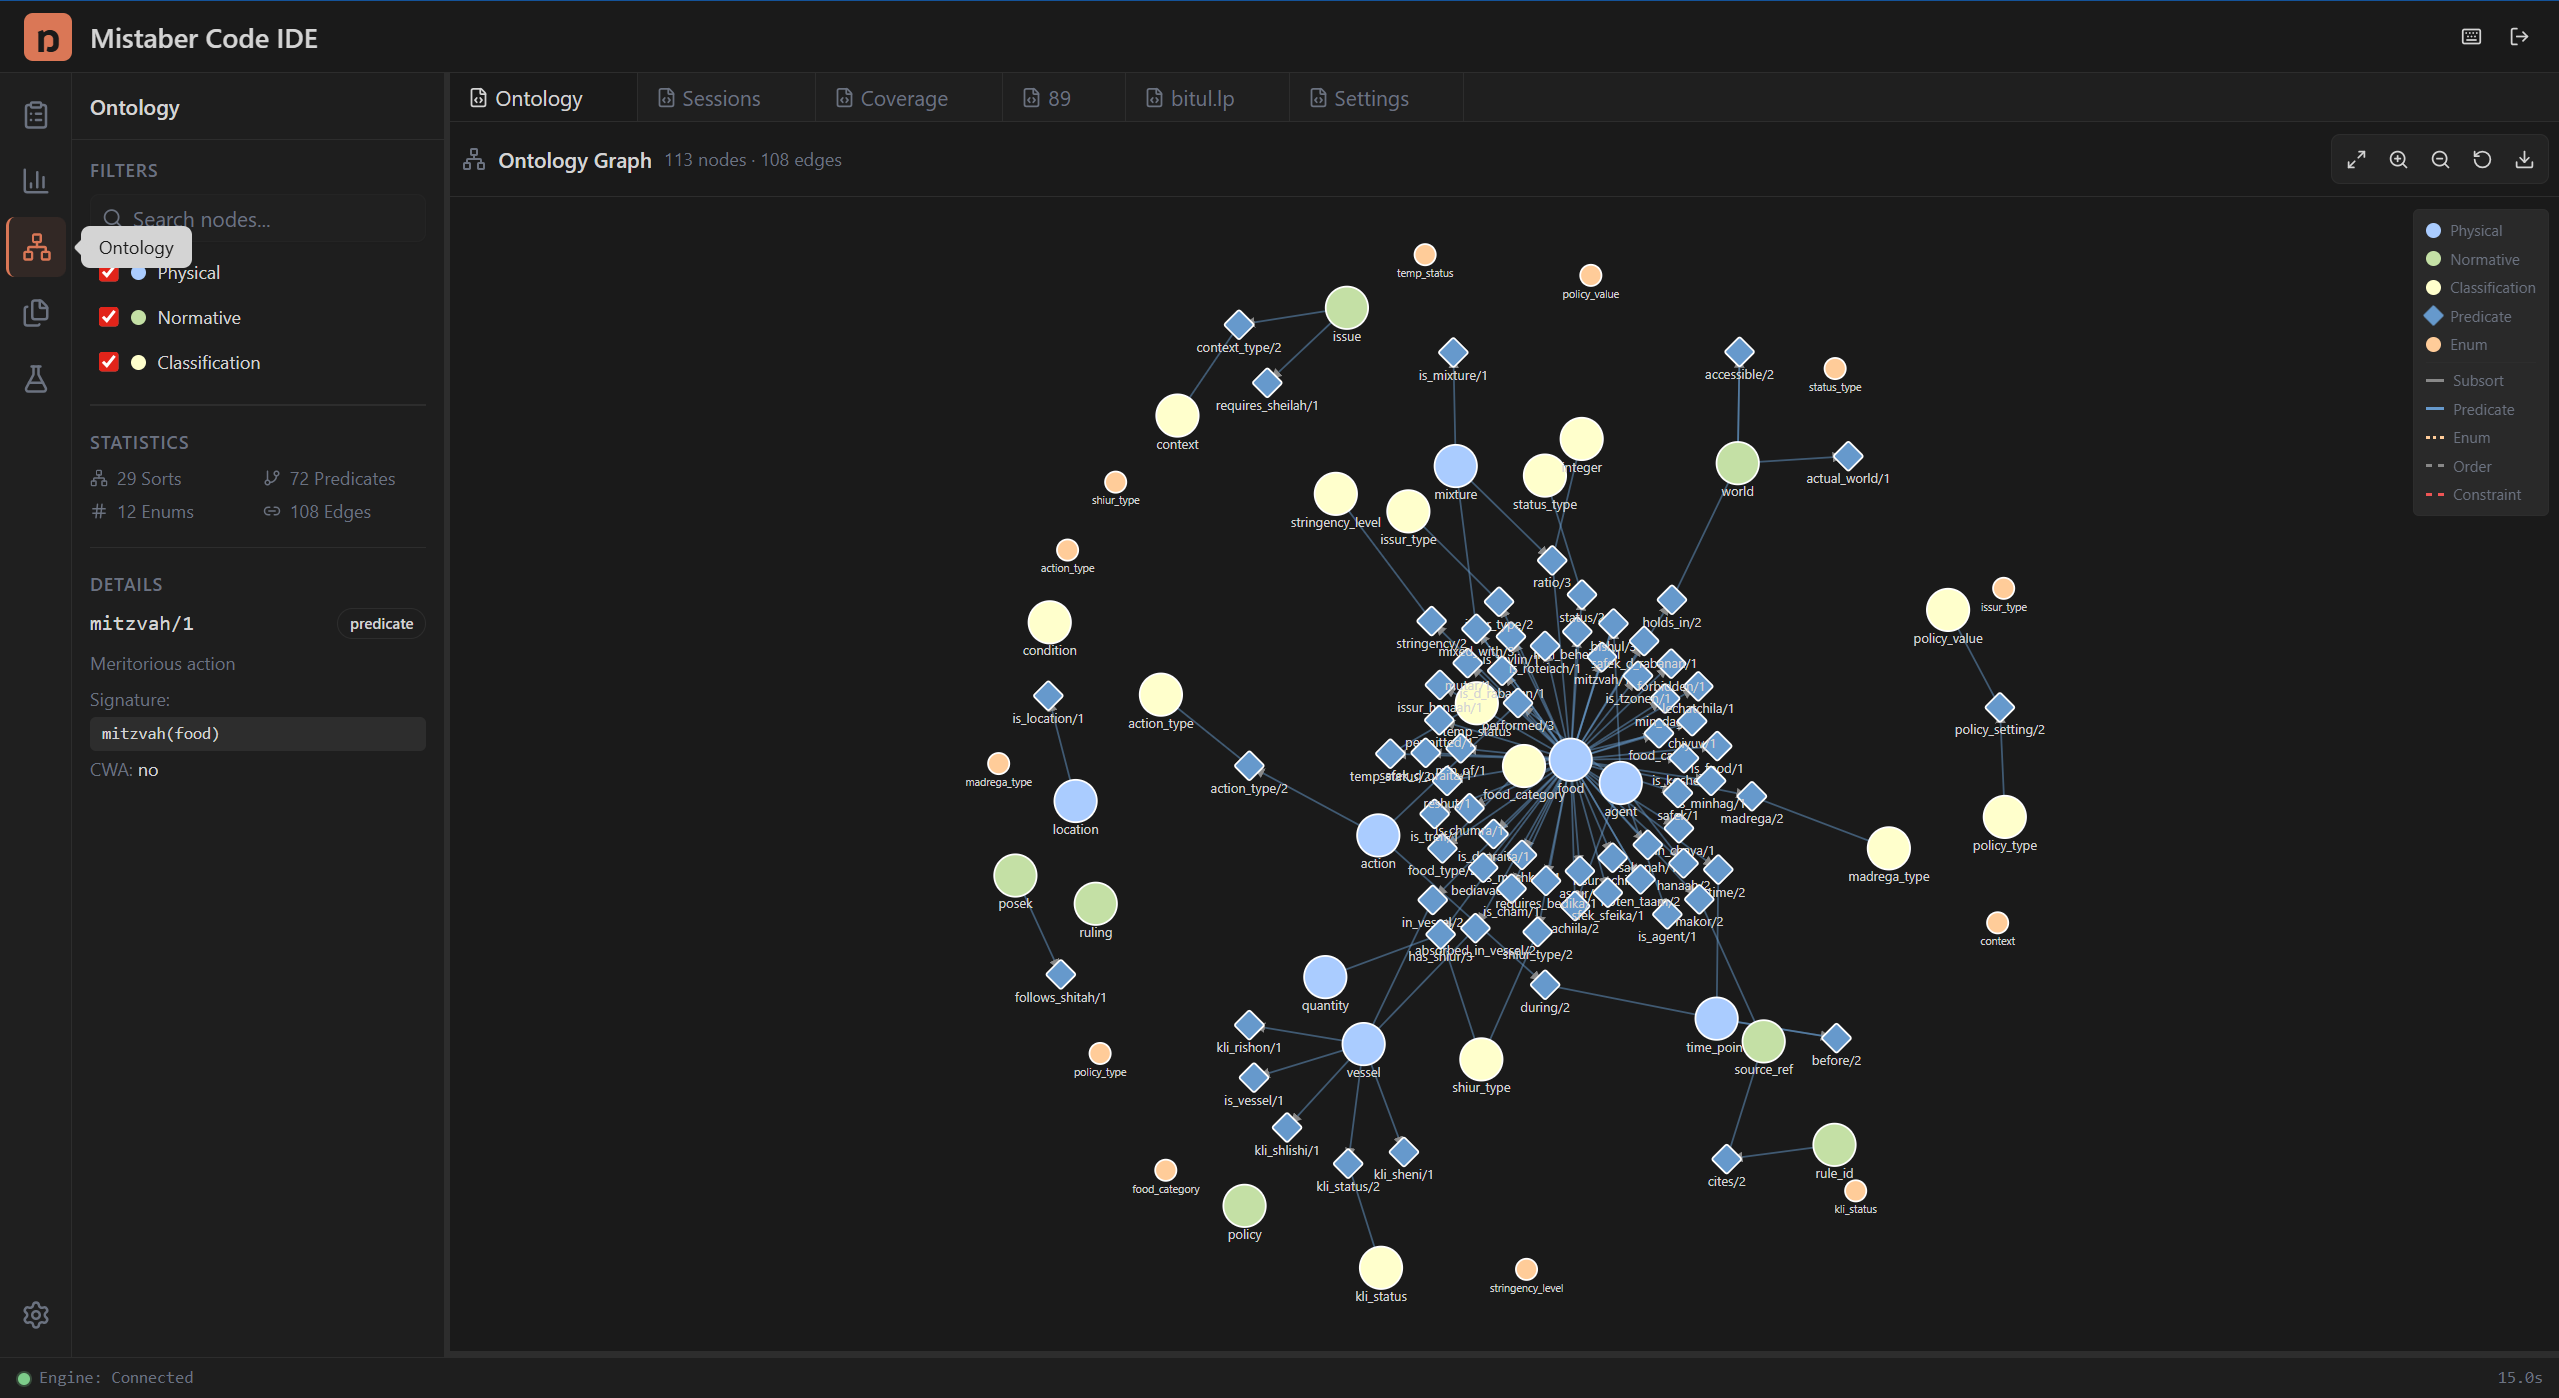
The Ontology panel displays the Mistaber ontology as an interactive force-directed graph. Use it to explore sorts (types), predicates (relations), and enums (fixed value sets) that make up the formal vocabulary.
Opening the Ontology Graph
- Click the Ontology icon (network) in the Activity Bar.
- The graph appears in the Editor Area with a toolbar and legend.
Understanding the Graph
Node shapes:
| Shape | Color | Meaning |
|---|---|---|
| Circle (large) | Light blue | Physical domain sort (e.g., food, vessel, mixture) |
| Circle (large) | Light green | Normative domain sort (e.g., issur, heter) |
| Circle (large) | Light yellow | Classification domain sort |
| Diamond | Blue | Predicate (relation between sorts) |
| Circle (small) | Orange | Enum type (fixed set of values) |
Edge styles:
| Style | Color | Meaning |
|---|---|---|
| Solid thick | Gray | Subsort relationship (inheritance) |
| Solid thin | Blue | Predicate connects to its argument sorts |
| Dotted | Orange | Enum belongs to a sort |
| Dashed | Gray | Ordering relationship |
| Dashed | Red | Constraint |
Predicate edges have arrowheads pointing from predicate to argument sort.
Interacting with the Graph
Select a node: Click any node to select it. A gold border highlights the selected node, and its details appear in the Ontology Sidebar (see Ontology Sidebar).
Hover for context: Hover over a node to dim everything except its direct neighbors. This reveals which sorts a predicate connects to, or which predicates reference a sort.
Pan and zoom: Drag the background to pan. Scroll to zoom in and out. The zoom range goes from 5% to 600%.
Drag nodes: Drag any node to reposition it. The simulation adjusts around your placement. Release the node to let it settle back into the force layout.
Deselect: Click the background to clear the selection.
Toolbar Controls
The toolbar appears above the graph when data is loaded. It shows a node and edge count (e.g., "113 nodes · 108 edges") and five buttons:
| Button | Icon | Action |
|---|---|---|
| Fit to View | Maximize | Zoom and pan to show all nodes |
| Zoom In | Magnifier+ | Zoom in |
| Zoom Out | Magnifier- | Zoom out |
| Reset Layout | Rotate | Recompute the force-directed layout from scratch |
| Export SVG | Download | Download the graph as an SVG vector image |
Filtering the Graph
Domain filters: The Ontology Sidebar includes domain filter toggles for Physical, Normative, and Classification. Disable a domain to hide its sorts from the graph. Predicates always show regardless of domain filters.
Search: Type in the search field to filter nodes by name. Only nodes matching the search text remain visible, along with their connecting edges.
The Legend
A compact legend appears in the top-right corner of the graph, identifying all node shapes/colors and edge styles.
Tips
- Use Fit to View after filtering to re-center the visible nodes.
- Reset Layout is useful when dragging has scattered nodes.
- Export SVG for inclusion in documentation or presentations.
- The graph currently shows 29 sorts, 72 predicates, and 12 enum types.