Getting Started
This page walks you through launching the Dashboard, logging in, and orienting yourself in the IDE.
Launching the Dashboard
Prerequisites: Mistaber installed.
Start the dashboard:
Open http://localhost:5173 in your browser.
Logging In

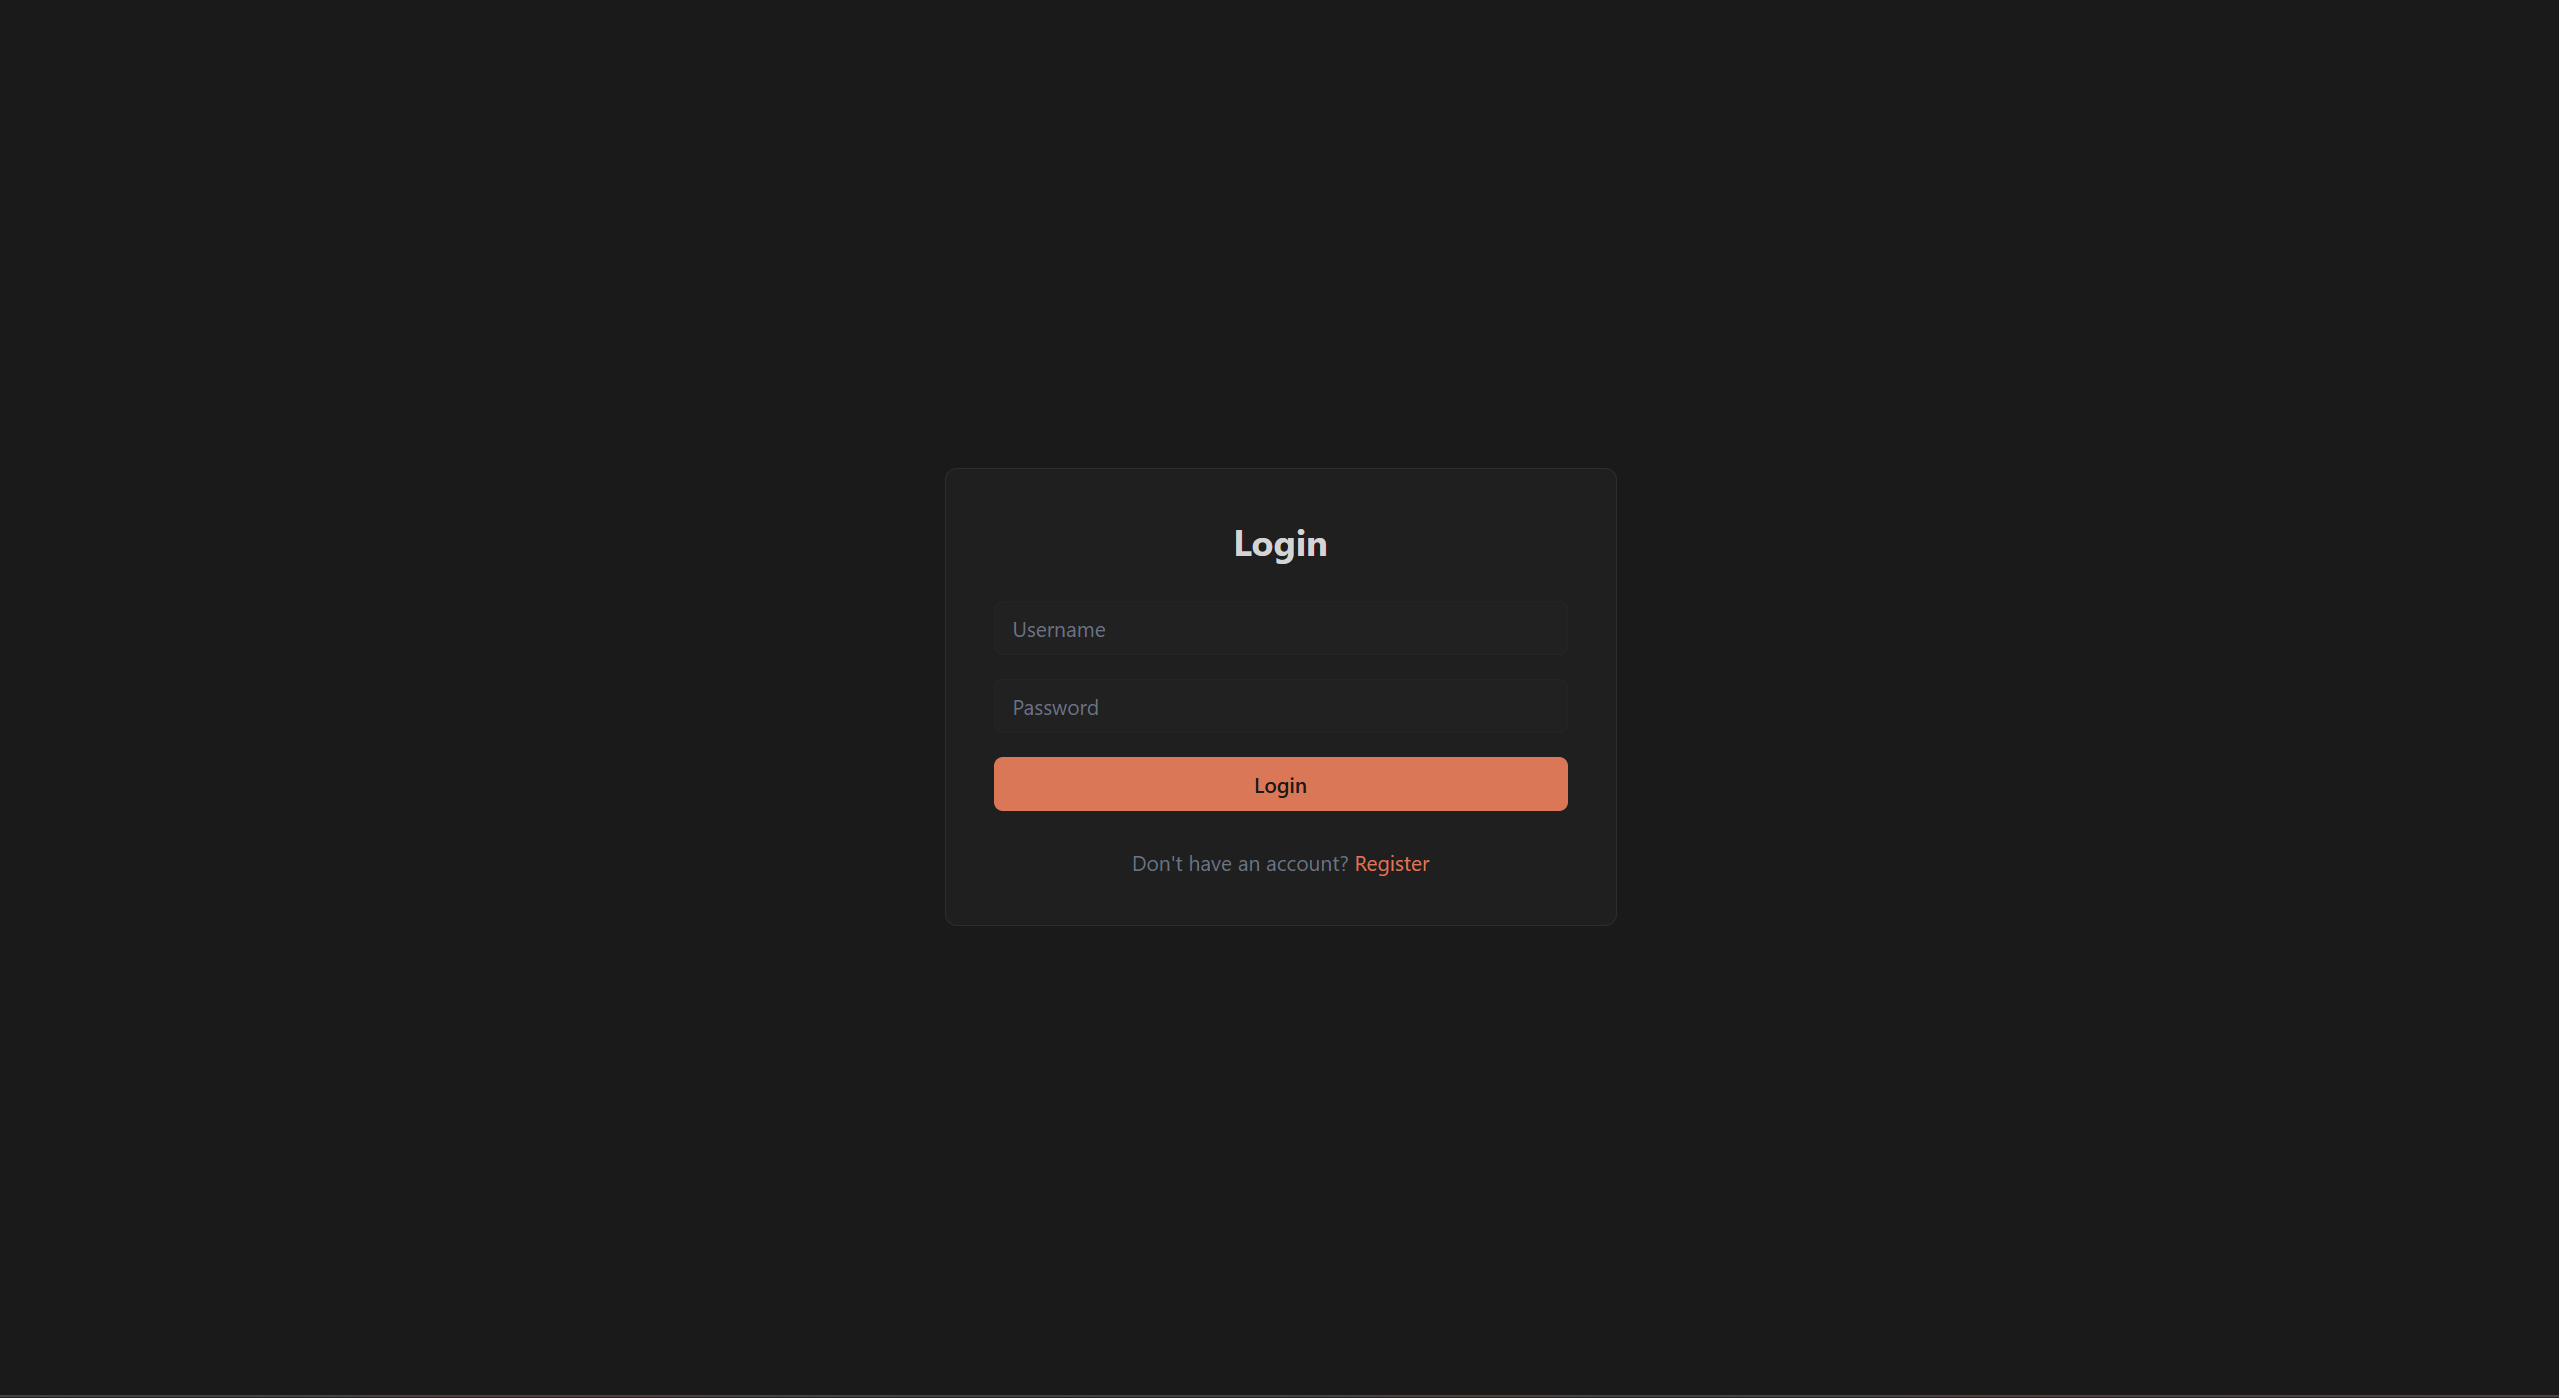
- On your first visit, register with a username and password.
- On subsequent visits, log in with those credentials.
- Your session persists until you log out.
The IDE Layout
1. Activity Bar
The Activity Bar sits at the far left. Five icons run top to bottom:
| Icon | Name | Purpose |
|---|---|---|
| Clipboard | Sessions | Manage encoding sessions |
| Bar chart | Coverage | View encoding coverage |
| Network | Ontology | Browse the ontology graph |
| Folder | Files | Navigate project files |
| Flask | Tests | Run validation tests |
A Settings gear sits at the bottom.
2. Sidebar Panel
The Sidebar Panel appears to the right of the Activity Bar. It displays the panel for whichever Activity Bar icon you selected. Drag the divider to resize it.
3. Editor Area
The Editor Area fills the center of the screen. It displays the main content: ontology graph, session details, file editor, or settings. Tabs at the top let you switch between open views.
4. Bottom Panel
The Bottom Panel contains Terminal and Output tabs. The terminal runs inside your session's git worktree. Toggle it with Ctrl+`. You can maximize it to fill the Editor Area.
5. Status Bar
The Status Bar spans the bottom of the window. It shows:
- Engine connection status — green dot means connected
- Atom count
- Response time
- Last saved time
Quick Orientation
- Click any Activity Bar icon to switch sidebar panels.
- Press Ctrl+K to open the Command Palette for quick navigation.
- Press Ctrl+B to toggle the sidebar.
- Press Ctrl+` to toggle the terminal.
- Press Shift+? to see all keyboard shortcuts.