Coverage Overview
The Coverage panel shows how much of the halachic corpus has been encoded. Use it to see which simanim and seifim are complete, in progress, or not yet started.
Opening Coverage
Click the Coverage icon (bar chart) in the Activity Bar. The sidebar shows a Coverage Summary with high-level metrics. The main Editor Area displays the full coverage dashboard.
The Coverage Dashboard
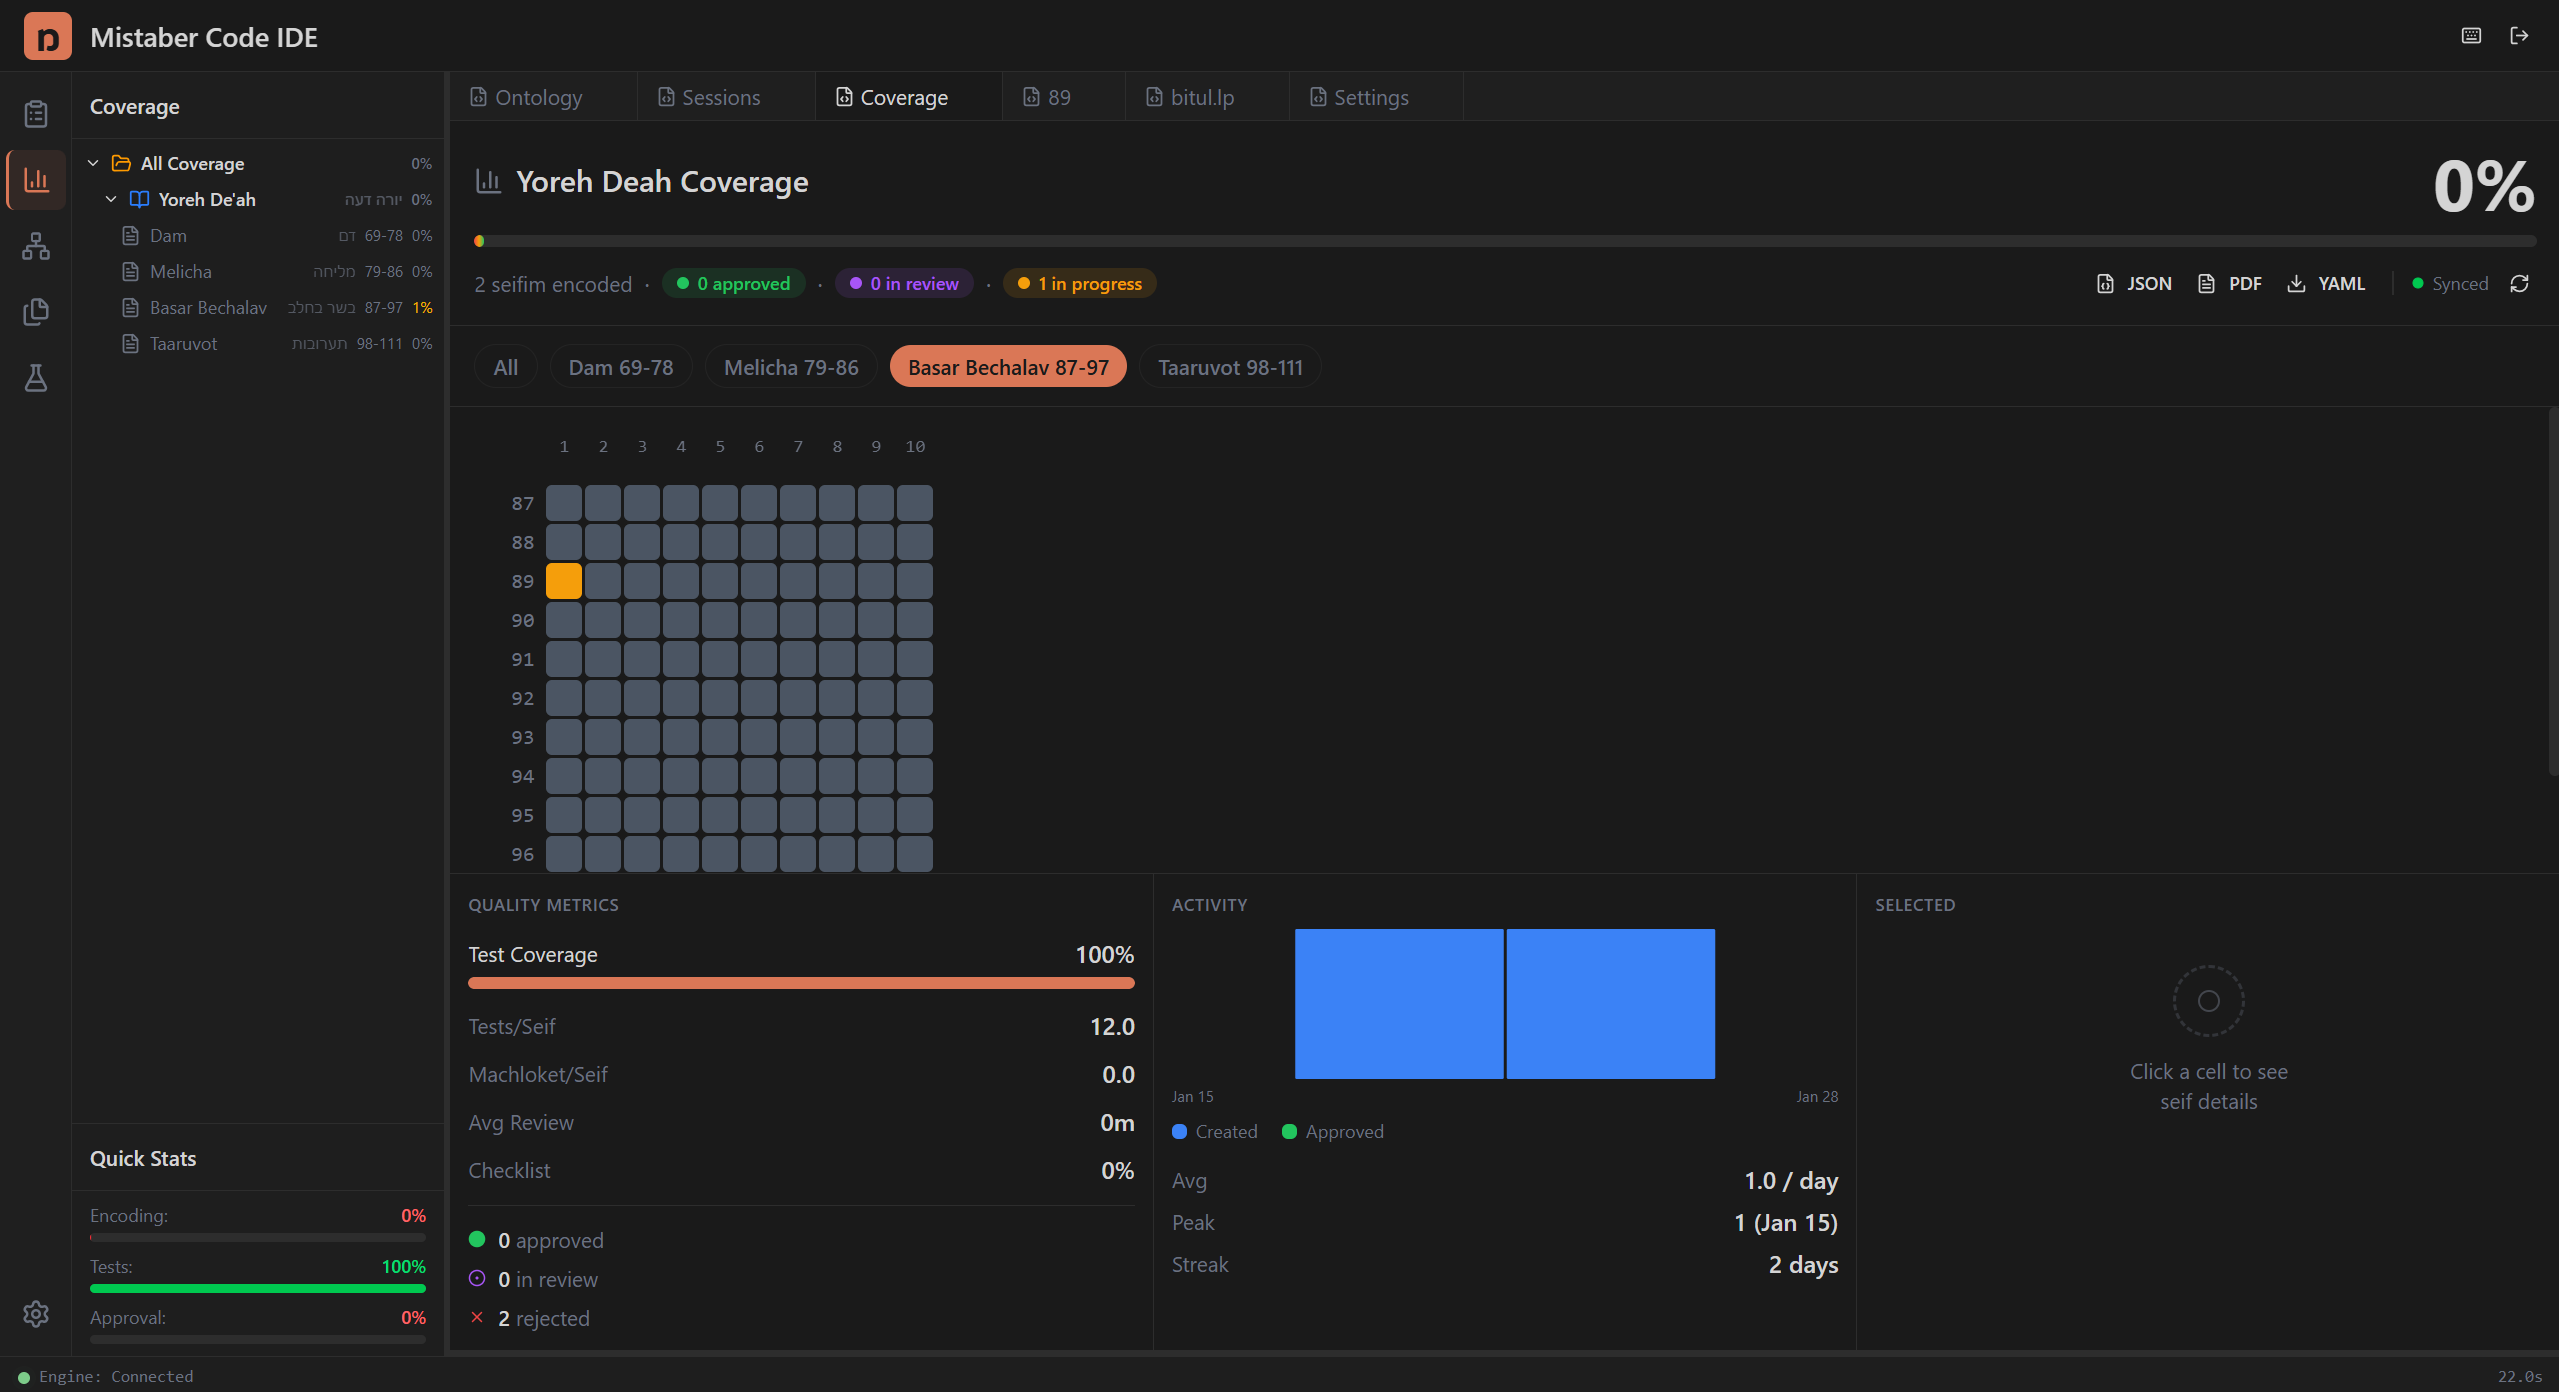
The dashboard contains several sections:
Coverage Header — Shows the overall coverage title and section context.
Section Chips — Colored chips representing each corpus section and its status. Click a chip to navigate to that section's details.
Coverage Heatmap — The main visualization. A grid of cells organized by siman (rows) and seif (columns). Each cell's color indicates encoding status. See Heatmap & Metrics for full details.
Quality Metrics — Summary cards showing test coverage percentage, tests per seif, machloket per seif, average review time, and checklist completion. Also shows counts of approved, in-review, and rejected encodings.
Activity Timeline — A 30-day bar chart showing encoding activity. See Heatmap & Metrics for details.
Coverage Navigation
Use the Coverage Navigation in the sidebar to jump between corpus sections. Click any section to load its coverage data in the dashboard.
Seif Details
Click any cell in the heatmap to see detailed information about that seif:
- Current encoding status
- Associated session (if any)
- Test results
- Review history
Double-click a cell to open its encoding session directly.
Tips
- Check coverage regularly to identify gaps in encoding progress.
- Green cells (approved) mean the seif is fully encoded and reviewed.
- Gray cells (not started) show where work remains.
- Use the section chips to quickly navigate large corpus areas.